Module 15 Data Case Study 4
The learning objectives of this module are:
Apply different parts of the data science workflow, for data import to data visualization, to a new data set
Build an R script with data wrangling and a R markdown file with the data analysis report
15.1 Data
For this module, we are using 2020 election data from Kaggle. More specifically, we want the president_county_candidate.csv data file.
15.2 Data Wrangling
We need to apply the following steps:
- Read data in R
- Explore data
- Add (with mutate) any other variables we find relevant
## Rows: 31,139
## Columns: 6
## $ state <chr> "Delaware", "Delaware", "Delaware", "Delaware", "Delaware…
## $ county <chr> "Kent County", "Kent County", "Kent County", "Kent County…
## $ candidate <chr> "Joe Biden", "Donald Trump", "Jo Jorgensen", "Howie Hawki…
## $ party <chr> "DEM", "REP", "LIB", "GRN", "DEM", "REP", "LIB", "GRN", "…
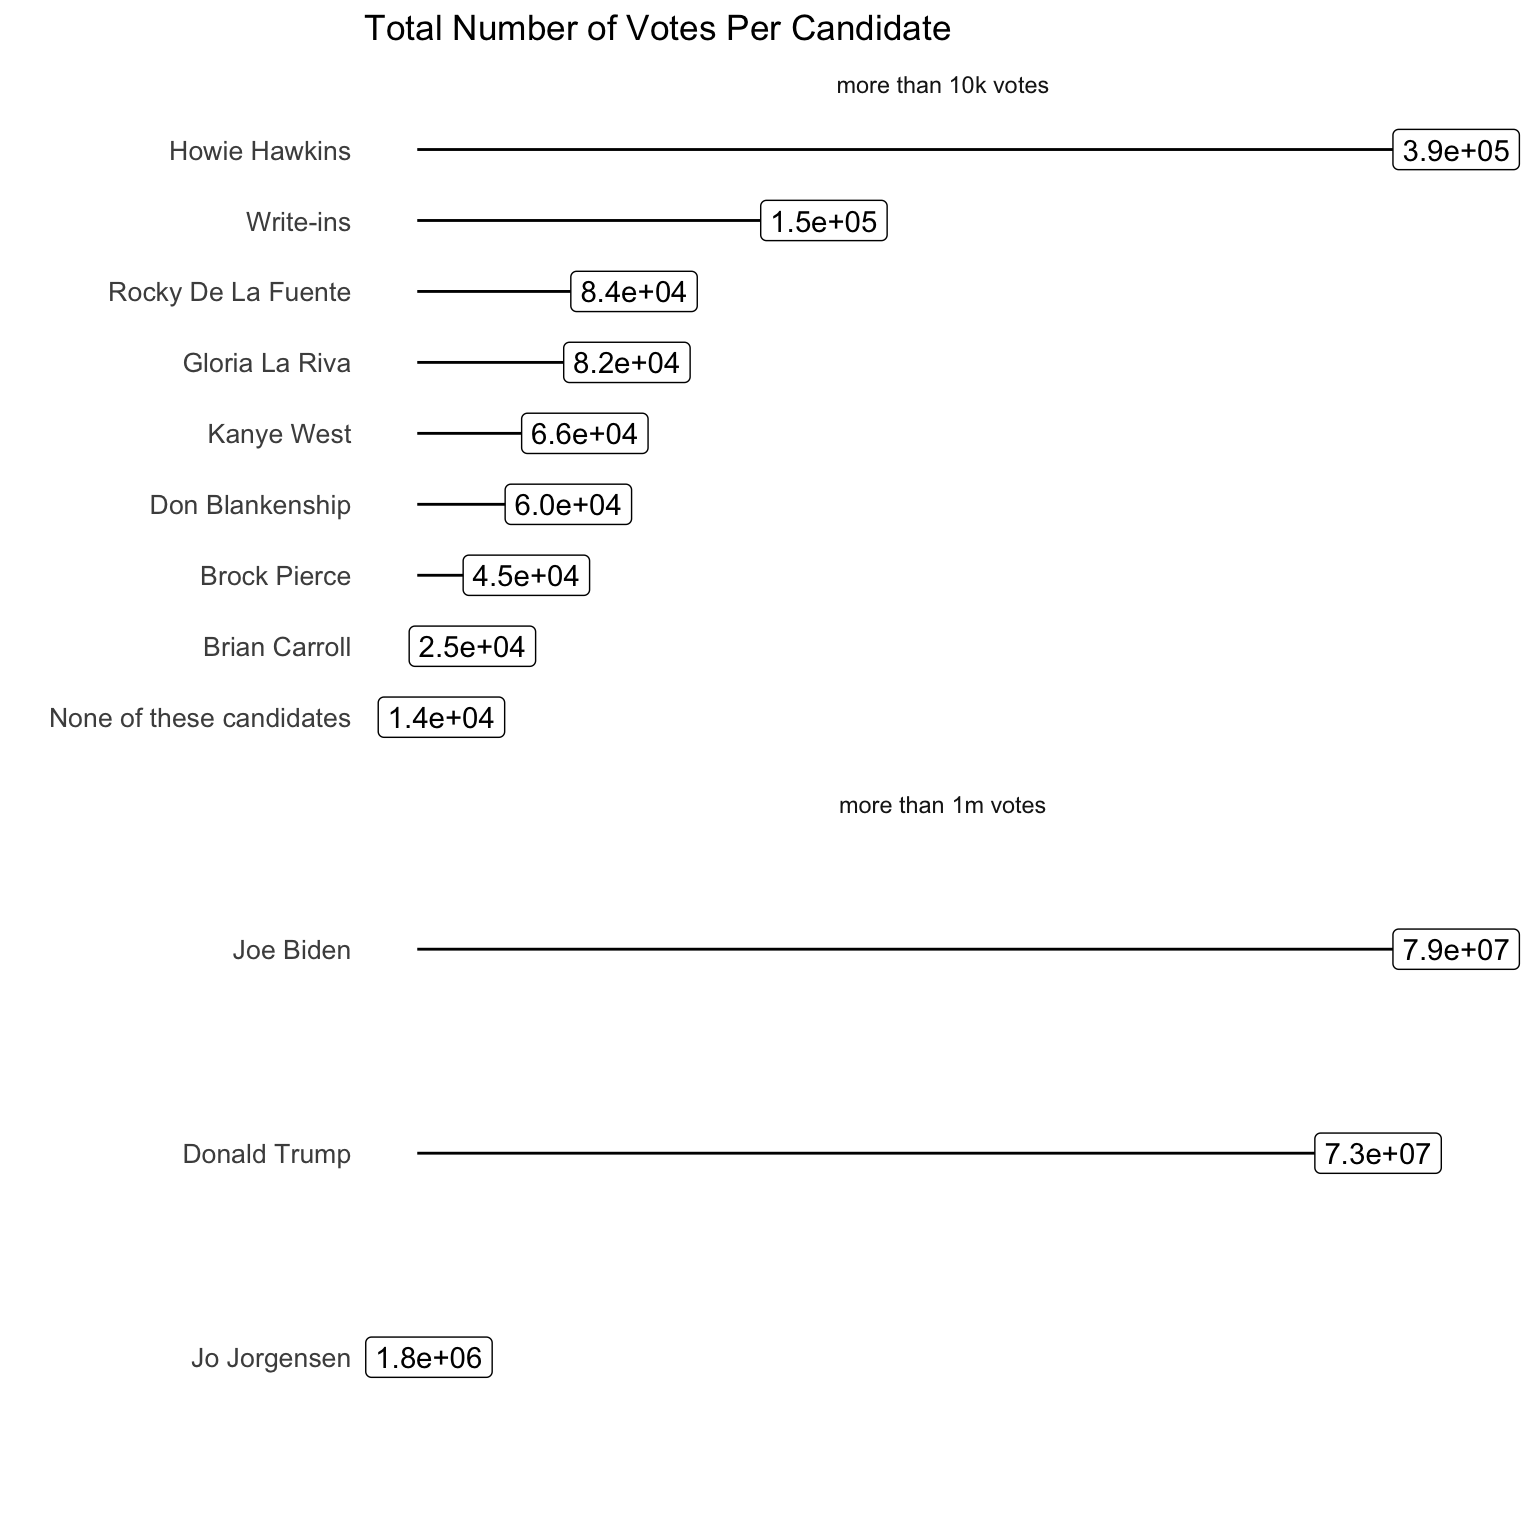
## $ total_votes <dbl> 44552, 41009, 1044, 420, 195034, 88364, 2953, 1282, 71230…
## $ won <lgl> TRUE, FALSE, FALSE, FALSE, TRUE, FALSE, FALSE, FALSE, TRU…How many votes total for each candidate?
We can get electoral votes per state. The best table I found is from wikipedia
## Rows: 51
## Columns: 2
## $ state <chr> "Alabama", "Alaska", "Arizona", "Arkansas", "Californ…
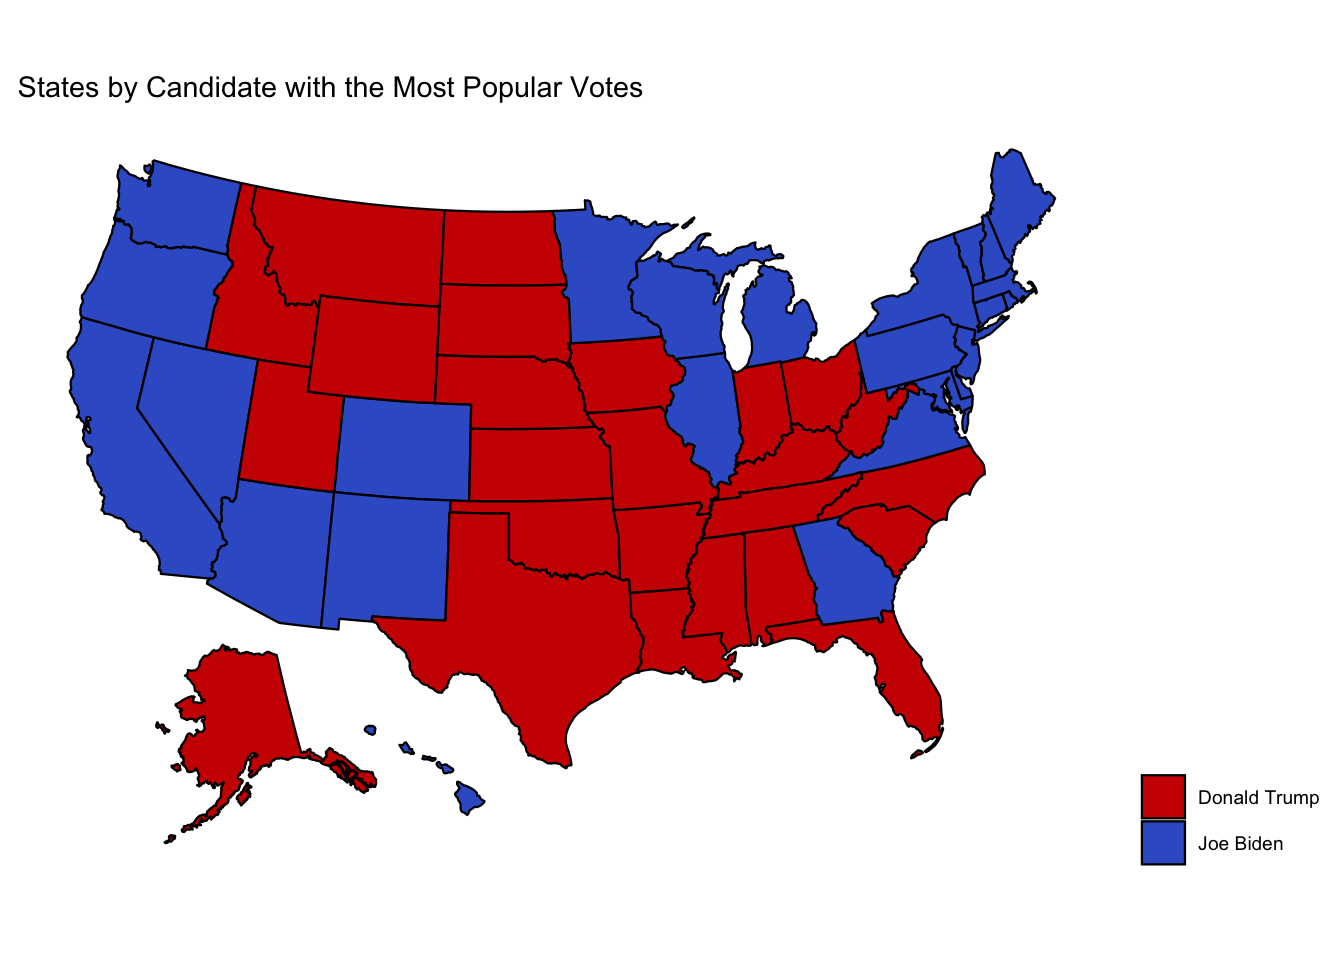
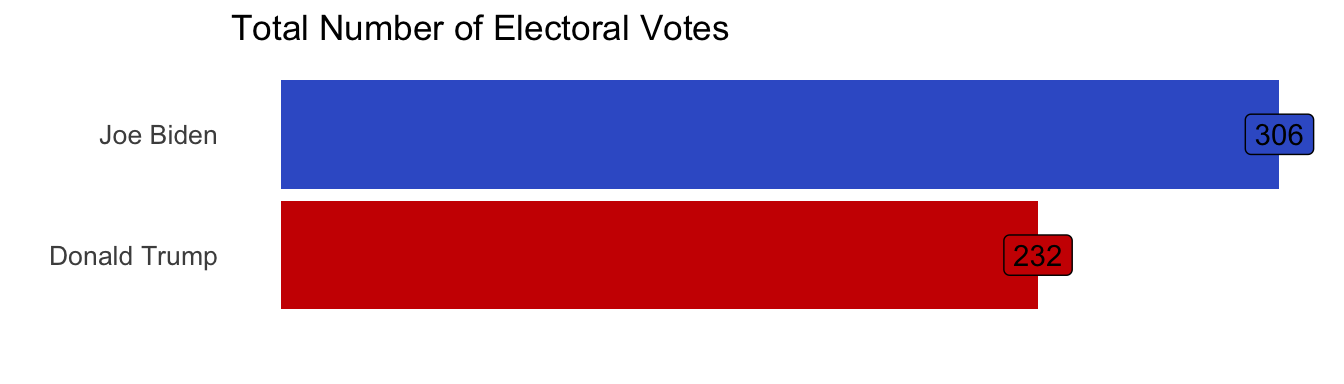
## $ electoral_votes <dbl> 9, 3, 11, 6, 55, 9, 7, 3, 3, 29, 16, 4, 4, 20, 11, 6,…How many electoral votes for each candidate? First we need to calculate who won each state.
## Rows: 51
## Columns: 2
## $ state       <chr> "Alabama", "Alaska", "Arizona", "Arkansas", "California",…
## $ total_votes <dbl> 2309900, 334789, 3384972, 1211793, 16822143, 3254844, 182…
## Rows: 51
## Columns: 5
## Groups: state [51]
## $ state <chr> "Alabama", "Alaska", "Arizona", "Arkansas", "California…
## $ candidate <chr> "Donald Trump", "Donald Trump", "Joe Biden", "Donald Tr…
## $ popular_vote <dbl> 1434159, 179080, 1671491, 758183, 10734181, 1803419, 10…
## $ total_votes <dbl> 2309900, 334789, 3384972, 1211793, 16822143, 3254844, 1…
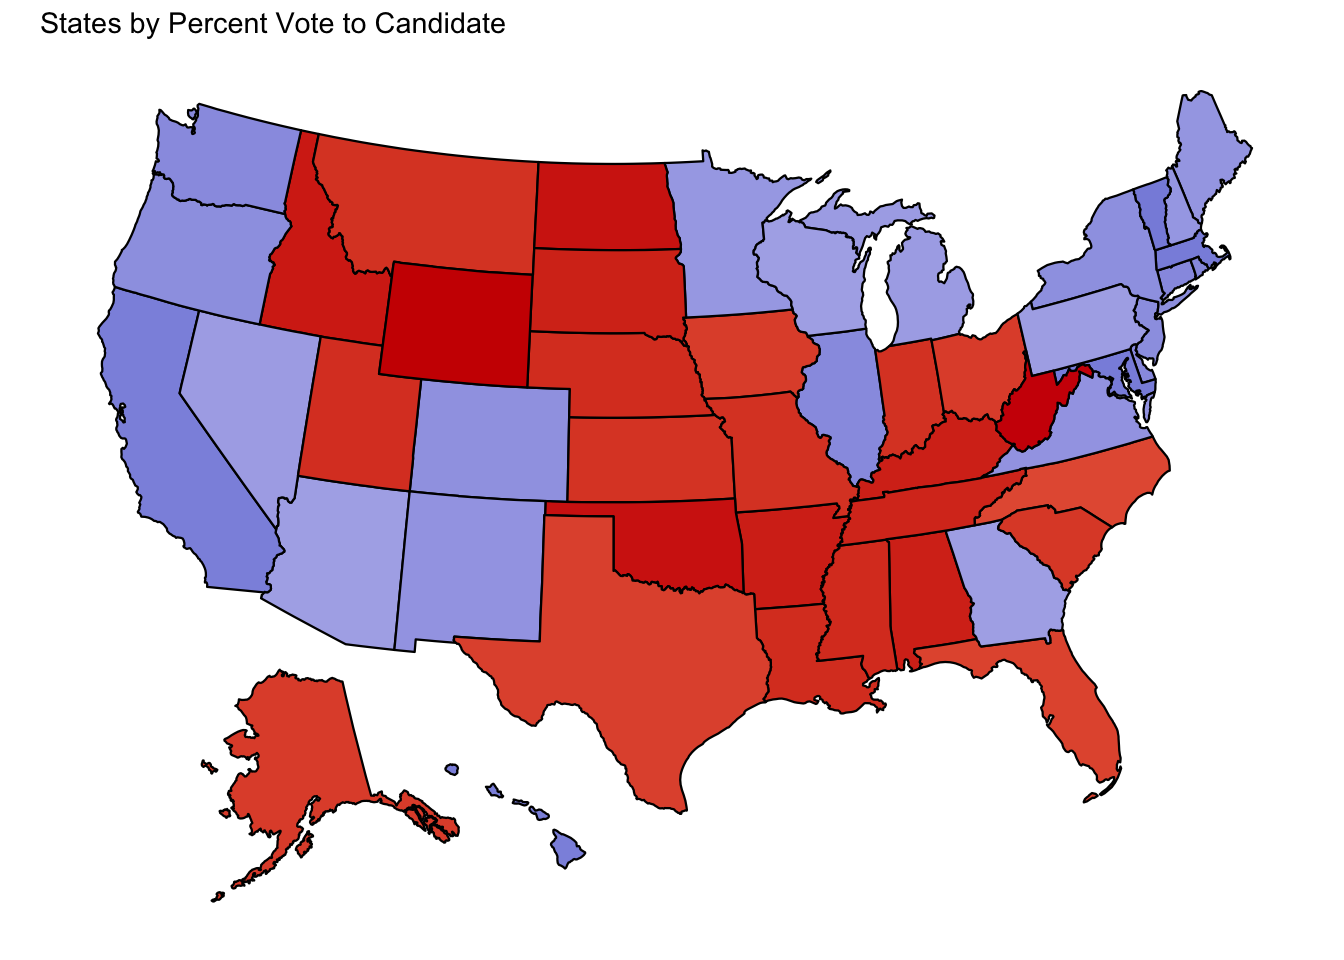
## $ perc_pop_vote <dbl> 0.6208749, 0.5349041, 0.4937976, 0.6256704, 0.6380983, …Now we can add electoral votes to winner by state data.
## Rows: 51
## Columns: 6
## Groups: state [51]
## $ state           <chr> "Alabama", "Alaska", "Arizona", "Arkansas", "Californ…
## $ candidate       <chr> "Donald Trump", "Donald Trump", "Joe Biden", "Donald …
## $ popular_vote    <dbl> 1434159, 179080, 1671491, 758183, 10734181, 1803419, …
## $ total_votes     <dbl> 2309900, 334789, 3384972, 1211793, 16822143, 3254844,…
## $ perc_pop_vote   <dbl> 0.6208749, 0.5349041, 0.4937976, 0.6256704, 0.6380983…
## $ electoral_votes <dbl> 9, 3, 11, 6, 55, 9, 7, 3, 3, 29, 16, 4, 4, 20, 11, 6,…
Plot it!
15.3 DATA CHALLENGE 09
Accept data challenge 09 assignment