Sampling Concepts
Population vs. Sample
- Target population:
- the entire group that you want to draw conclusions about
- defined in terms of age, job, political afilitation, geographical location, age, income
- Sample: the specific group of individuals that you will collect data from
What is sampling?
- Sampling is the process of selecting a subset of individuals from a larger population to estimate characteristics of the whole population
- It’s like tasting a spoonful of soup to judge how the entire pot tastes.
- The goal is to make inferences about a large population when studying every member would be impractical or impossible
- It is also used to reduce costs and time while still getting reliable information
Random Sampling
- Simple random sampling: Every member of the population has an equal chance of being selected
- Systematic sampling: Selecting every nth member from a population
- Stratified sampling: Dividing the population into subgroups (strata) and sampling from each
- Cluster Sampling: Dividing the population into subgroups or clusters, and then some of these clusters are randomly selected for study – all members within those chosen clusters are included in the sample.
Examples
A high school wants to survey students about cafeteria food. They have 1,000 students.
- Simple random sample: a computer randomly selects 100 student ID numbers (every student has an equal chance of being selected)
- Stratified sampling: 25 students of each grade level is randomly selected
- Systematic sampling: every 10th student in the school roster is selected
- Cluster sampling: homerooms are randomly selected, every student in the homeroom is selected
Examples
A city wants to study household energy usage. Instead of sampling random houses across the entire city, they randomly select 20 neighborhoods and study all houses within those neighborhoods
A quality control inspector at a candy factory checks every 50th chocolate bar coming off the production line. If they start with the 5th bar, they would check bars #5, #55, #105, and so on.
Examples
A city wants to study household energy usage. Instead of sampling random houses across the entire city, they randomly select 20 neighborhoods and study all houses within those neighborhoods – cluster sampling
A quality control inspector at a candy factory checks every 50th chocolate bar coming off the production line. If they start with the 5th bar, they would check bars #5, #55, #105, and so on – systematic sampling
Other types of sampling
- Convenience sampling: Selecting easily accessible subjects
- Purposive sampling: Choosing subjects based on specific characteristics
- Quota sampling: Selecting subjects based on predetermined proportions
Examples
A high school wants to survey students about cafeteria food. They have 1,000 students.
- Convenience sampling: students who happen to be at the cafeteria on a Tuesday are selected
- Purposive sampling: students who eat at the cafeteria at least three days a week are selected
- Quota Sampling: quotas by age group are determined, with 50% of students between 16-17 years old, and 50% of students 18 or older – they continue sampling until they meet these quotas
Examples
A researcher studying the effects of marathon running on the body specifically selects participants who have completed at least three marathons in the past year.
A researcher studying shopping habits interviews customers who happen to be at the mall on a Tuesday afternoon. They’re chosen simply because they’re conveniently available.
Examples
A researcher studying the effects of marathon running on the body specifically selects participants who have completed at least three marathons in the past year – purposive sampling
A researcher studying shopping habits interviews customers who happen to be at the mall on a Tuesday afternoon. They’re chosen simply because they’re conveniently available – covenience sampling
Gradescope activity
Go to gradescope and answer the questions about samples
Consideration re samplings
- Sample Size: Larger samples generally provide more accurate estimates but require more resources
- Representativeness: The sample should reflect the key characteristics of the population
- Sampling Error: The difference between the sample estimate and the true population value
- Bias: Systematic errors that can occur due to poor sampling method
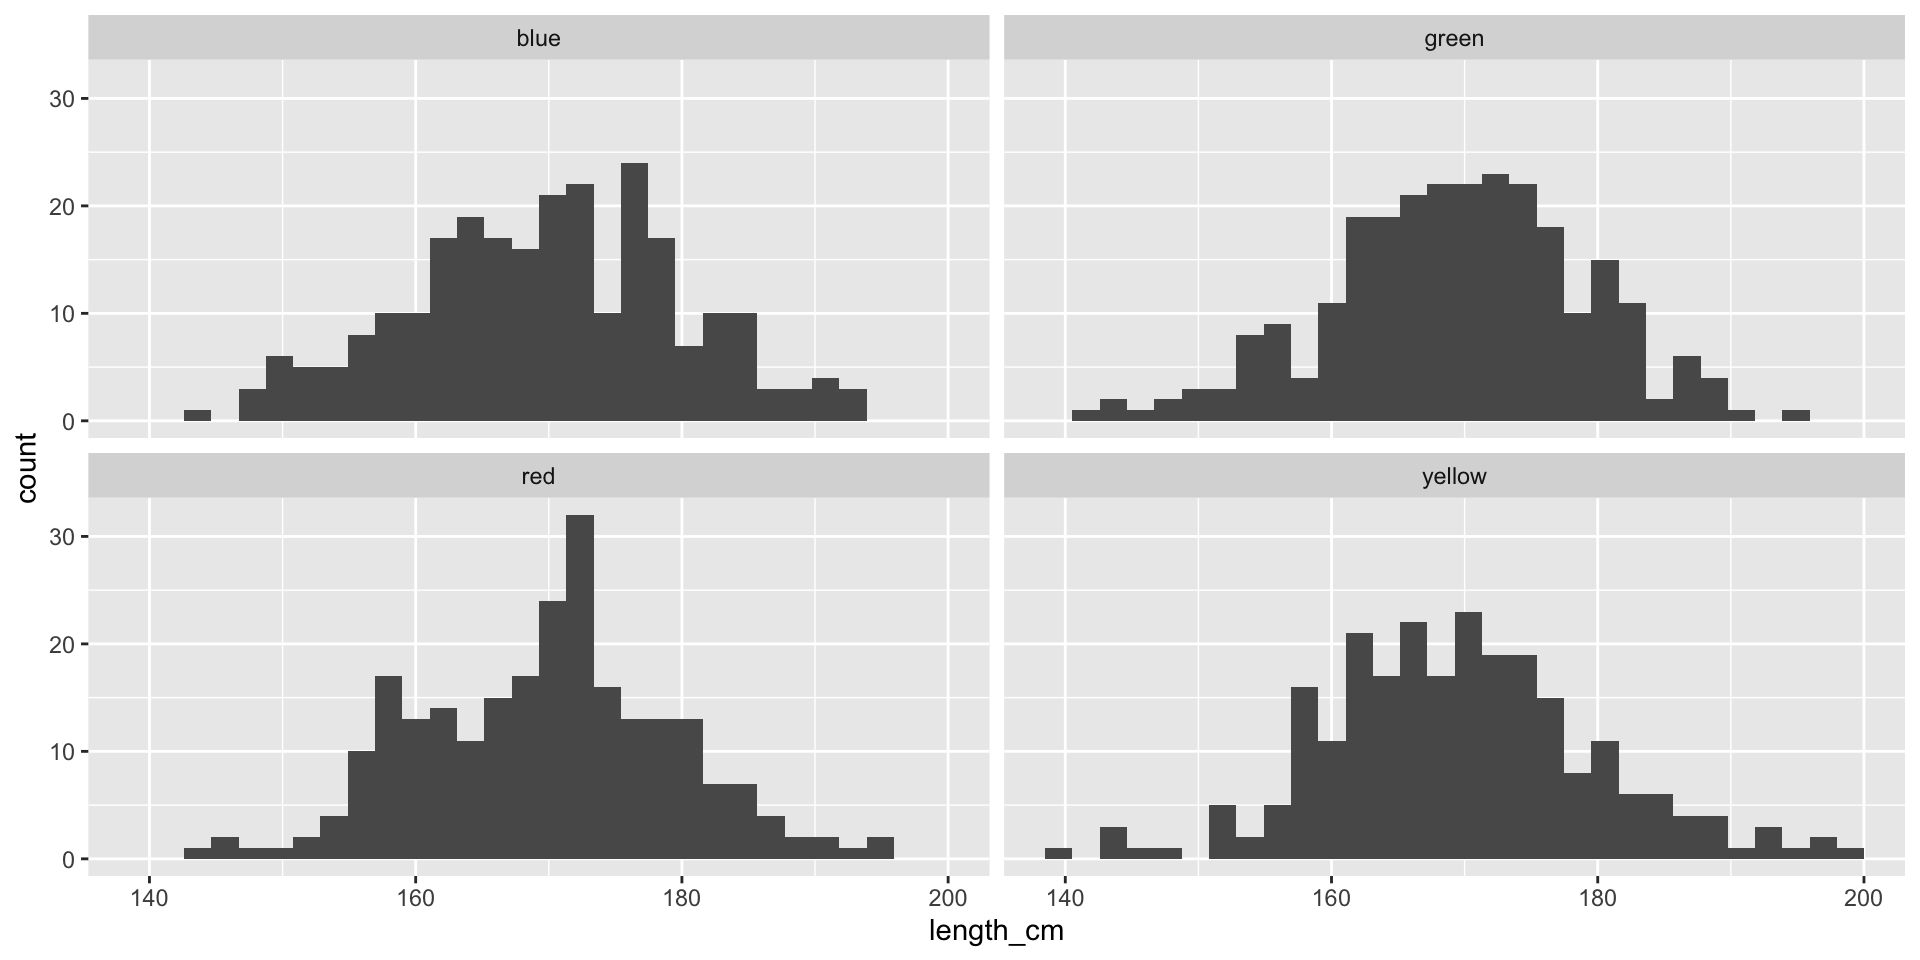
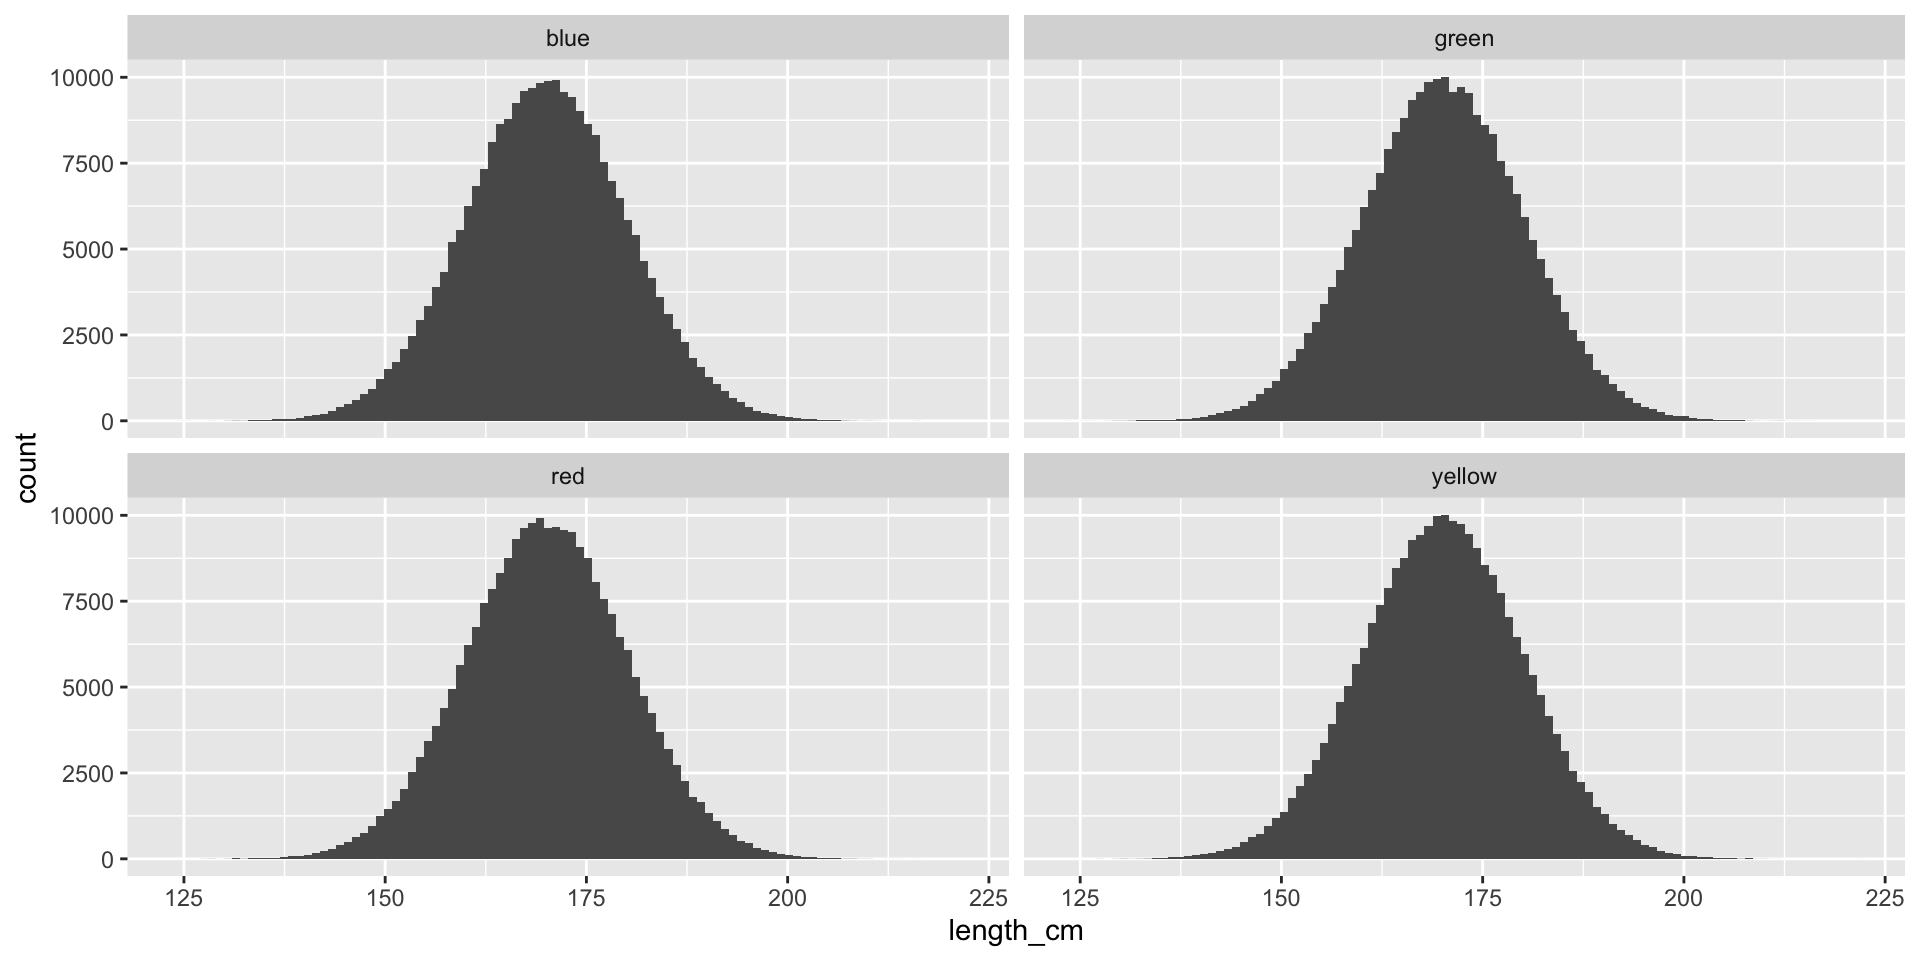
Simulation
We will be working with simulated data for practing sampling.
Distribution
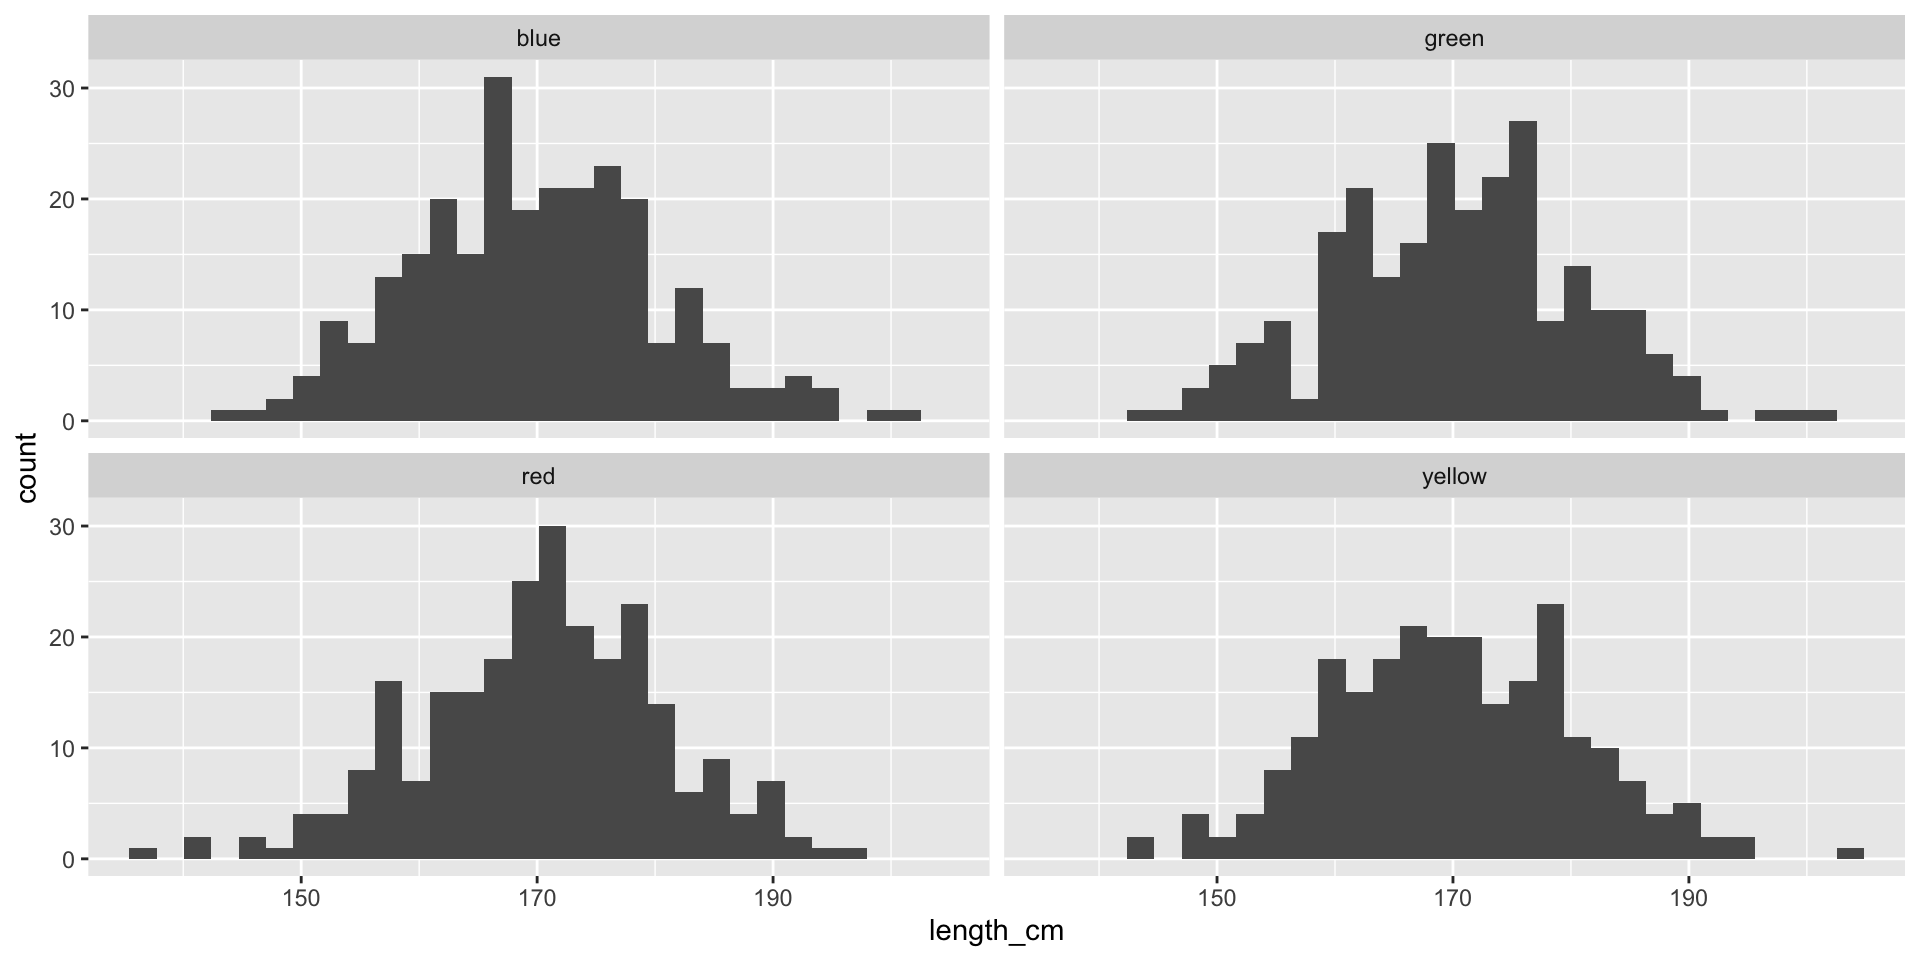
Random Sampling
Measures of Centrality
Measures of Centrality
Systematic sampling